I have several IoT sensors at home and now I came to the point that I would like to introduce some solid platform for storing sensor data and visualizing them. This post summarize all platforms that I tried, searched and evaluated.

The Final Selection
After all considerations I decided to use:
- digitalocean.com for 24/7 Ubuntu 512MB Memory, 20GB SSD server (5USD/month) – you can use this link to get $10 in credit.
- InfluxDB
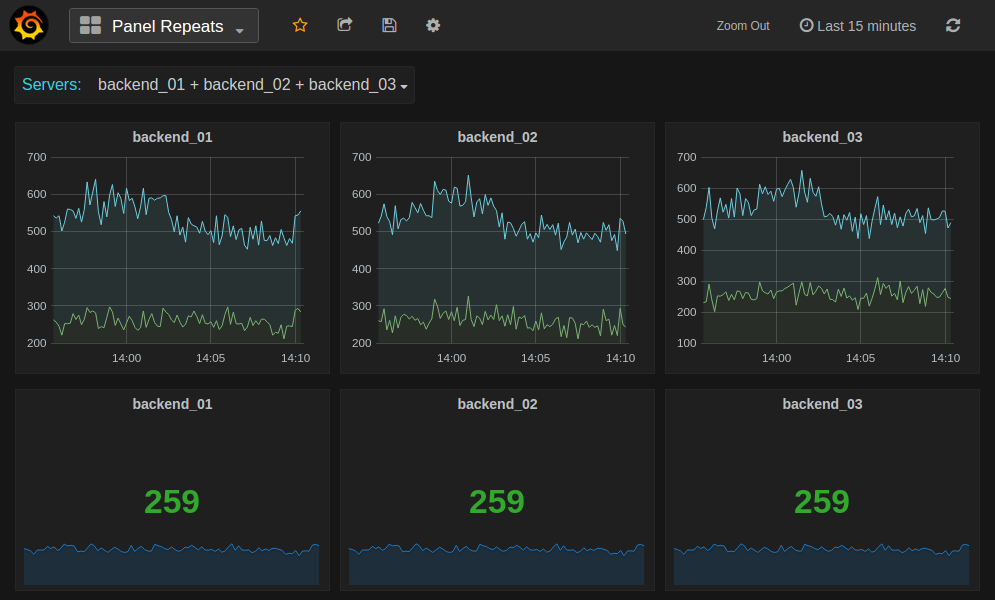
- Grafana
- freenom.com
The result looks quite interesting for me:
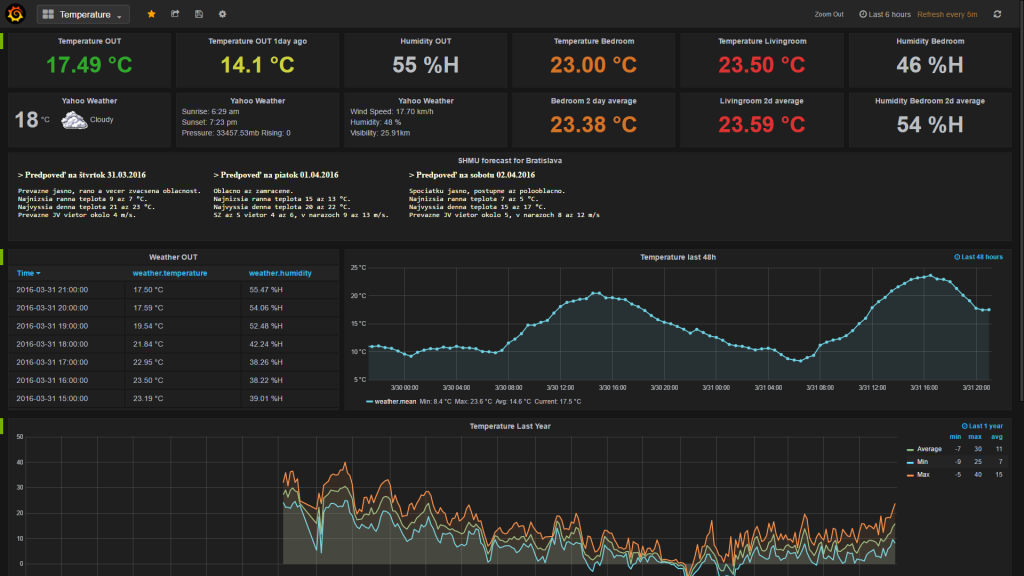
Ask in comments for installation scripts. Once I will have time, I will create a post with describing that installation scripts.
There is also a simple InfluxDB and Grafana hosting for your projects. You can just try corlysis platform to help you with storing and visualizing your time-series data.
Home Made – LAMP Based
For the really basic IoT home made IoT data server, I have started with LAMP (or better LAP) server on my Cubieboard2 with Ubuntu 14.04 running 24/7. The basic idea is just to expose apache server that stores all HTTP GET attributes to the file via php. Additional info like HTTP_USER_AGENT and server timestamp is also stored in json format.
I used this simple php file (SensorWriteToFile.php) to store the IoT data:
<?php

// URI: /SensorWriteToFile.php?temp=23.50&hum=48.20

date_default_timezone_set('Europe/Bratislava');
$dateTime = new DateTime();
$dateTimeStamp = $dateTime->format('Y-m-d H:i:s');

$data = $_REQUEST;
$data += array("datetime" => $dateTimeStamp );
$data += array("user_agent" => $_SERVER['HTTP_USER_AGENT'] );
$req_dump = json_encode( $data ) . "\n";

$fp = file_put_contents( '/var/www/request.log', $req_dump, FILE_APPEND );  //  make /var/www/request.log file writable !!

?>
Sample of the log file (/var/www/request.log) with proper write access:
{"temp":"25.10","hum":"72.10","datetime":"2016-02-07 20:29:58","user_agent":"Mihi IoT 01"}
{"temp":"25.20","hum":"69.30","datetime":"2016-02-07 20:31:06","user_agent":"Mihi IoT 01"}
{"temp":"25.40","hum":"75.40","datetime":"2016-02-07 20:32:10","user_agent":"Mihi IoT 01"}
{"temp":"25.40","hum":"70.30","datetime":"2016-02-07 20:33:15","user_agent":"Mihi IoT 01"}
{"temp":"25.10","hum":"65.10","datetime":"2016-02-07 20:34:37","user_agent":"Mihi IoT 01"}
{"temp":"25.00","hum":"66.40","datetime":"2016-02-07 20:35:40","user_agent":"Mihi IoT 01"}
{"temp":"25.00","hum":"66.00","datetime":"2016-02-07 20:36:49","user_agent":"Mihi IoT 01"}
{"temp":"25.00","hum":"64.10","datetime":"2016-02-07 20:37:51","user_agent":"Mihi IoT 01"}
You can install LAMP on you home PC or rent a VPS starting at $3.49/month in www.ovh.com/us/vps/ or www.digitalocean.com/pricing/
Cloud Base
- freeboard.io – Visualize the Internet of Things.

- DeviceHub.net is used for data gathering, cloud logic, triggers, real time remote control and analytics in a friendly user interface.

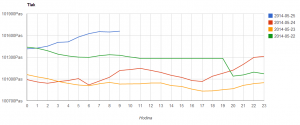
- sparkfun data based on phant.io. Based on phant blog, you can store data and use google api chart:

- analog.io is a graphing front end that is backend agnostic. Users have the freedom to host their own data locally, within the analog.io cloud, or choice of 3rd party services such as data.sparkfun.com.

- dweet.io is simple messaging (and alerts) for the Internet of Things. It’s like Twitter for IoT machines.

Open Source Installtions
- InfluxData is for IoT deployments requiring support for thousands of sensors. Collect, store, visualize and alert on time-series data.

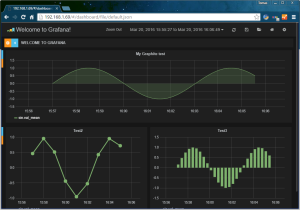
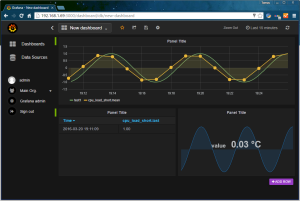
 Platform combines InfluxDB, Chronograf, Telegraf and Kapacitor. Although, you may find many basic installations of InfluxDB and Grafana. I was able to install both in my Ubuntu, used script to import sinus data and created basic Grafana dashboard. You can play with grafana on their demo side: stats.grafana.org.


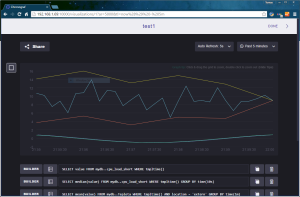
I have also tried InfluxDB with Chronograf together. Chronograf is a simple to install graphing and visualization application that you deploy behind your firewall to perform ad hoc exploration of your InfluxDB data. The cadence for Chronograf releases is every 4 weeks.

- Elasticsearch + Kibana – maybe overkill but also an option. Elastic search as storage and Kibana as viewer. Java is requeired

- http://prometheus.io/
- https://www.datadoghq.com/
- https://www.loggly.com/
- phant.io
- graphite.wikidot.com
Smart Hubs Platforms
There are several platforms sold by vendors that integrates all types of protocols and collects data for later visualization. I have used openHAB installed on Ubuntu, but you can also buy HW that is ready to use with you existing sensors.
openHAB is an open source home automation system that’s both hardware-agnostic and protocol-agnostic. I have installed it and changed demo to my temperature sensor and also used yahoo wather data.
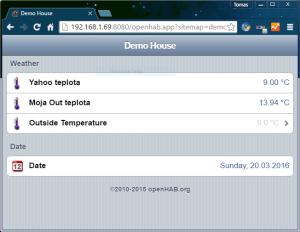
To understand concept of openHAB you have to look in 5 main areas that are highly customizable:
- Items for sensor configuration
- Bindings to items for all kind of sensor connection (URL, exec, mqtt, and hundreds more)
- Sitemap for wizard like visualization with selection of various user interfaces
- Persistence for data storage (file, various DBs,..)
- Automation by defining rules and scripts
Basic installed files takes less then 50MB of storage but Java is required.
Good smart hubs overview is here: http://www.makeuseof.com/tag/smart-hubs-solution-going-automate-home/
- SmartThings Hub
- Insteon Hub
- VeraLite
- Staples Connect Hub
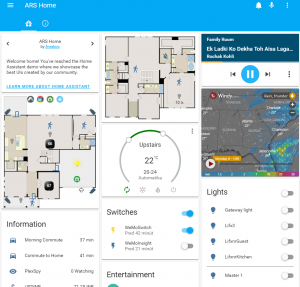
home-assistant.io
Check also home-assistant.io reddit.com/r/homeassistant/.
Open source home automation that puts local control and privacy first. Powered by a worldwide community of tinkerers and DIY enthusiasts. Perfect to run on a Raspberry Pi or a local server.
- Home Assistant will track the state of all the devices in your home, so you don’t have to.
- Control all your devices from a single, mobile-friendly, interface.
- Set up advanced rules to control devices and bring your home alive.





in your grafana Dashboard, how did you display ‘Yahoo Weather’ & Bratislava weather, did you make a new grafana plugin for these ?
It is HTML panel. The first one is with java script that loads the Yahoo data and the others are only placement for the html ID elements. I have copied the code here:
https://gitlab.com/snippets/25939
https://gitlab.com/snippets/25940
I’m now considering also: http://openweathermap.org/api
Their API is simpler and data looks more relevant so you can try also that one.
Bratislava weather is done other way. I have created a php page (data crawled from weather local portal) and then only used it in iframe. Example:
I use PHP to store data in a file in my local network small PC (cubieboard) and then cron is using perl script to store it also to InfluxDB in cloud by CURL:
Perl script reads the file, parse temperature and humidity and then post its to influxDB:
$influxdb = ‘curl -i -XPOST “https://URL/data/write?db=mydb” –data-binary “weather,area=petrzalka,location=out temperature=’ . “$out_temp” . ‘,humidity=’ . “$out_hum” . ‘ ‘ . “$out_epoch” . ‘000000000″ 2>&1’;
`$influxdb`;
PHP in my local network ubuntu PC looks simple like this:
date_default_timezone_set(‘Europe/Bratislava’);
$dateTime = new DateTime();
$dateTimeStamp = $dateTime->format(‘Y-m-d H:i:s’);
//adds my custom attributes, readable timestamp, user_agent and EPOCH time
$data = $_REQUEST;
$data += array(“datetime” => $dateTimeStamp );
$data += array(“user_agent” => $_SERVER[‘HTTP_USER_AGENT’] );
$data += array(“epoch” => time() );
$req_dump = json_encode( $data ) . “n”;
//write data to file
$fp = file_put_contents( ‘/var/www/test_request.log’, $req_dump, FILE_APPEND );
You should be also able to send it directly from Arduino/ESP8266. Check: https://www.influxdata.com/how-to-send-sensor-data-to-influxdb-from-an-arduino-uno/
Thanks Tomas – I need to get more into curl and PHP as I am more the hardware guy 🙂 Check this one also: https://hwwong168.wordpress.com/2015/11/23/esp8266-writing-data-into-influxdb/ – seems to be a very effective approach also.
Maybe this should be added as well?
OpenEnergyMonitor: Home
https://openenergymonitor.org/
Översätt den här sidanIntroducing the OpenEnergyMonitor system. Pre-assembled open-hardware electricity, temperature and humidity monitoring units based on the Arduino and …